


: Bitcoin Bounces Slightly")


Assessing the U.S. Temperature and Precipitation Analysis in July 2025 | News

Key Point:
- Warm overnight minimum temperatures set July records, impacting more than 55 million people across the eastern states.
- In July, 1,434 flash flood warnings—the second-highest July total in 40 years—and 17 flash flood emergencies were issued nationwide, along with over 2,000 preliminary flood-related storm reports.
- Most notably, catastrophic flooding in the Texas Hill Country in early July resulted in at least 135 fatalities, following extreme rainfall of up to 20 inches over just a few days.

Temperature
The average temperature for the contiguous U.S. (CONUS) in July 2025 was 75.4°F, 1.8°F above the 20th-century average, ranking in the warmest third of the 131-year record. Temperatures were above average across much of the Mountain West and much above average across the eastern U.S., while most of the Plains saw near-average conditions. Virginia and West Virginia each tied their warmest July on record, while all Atlantic coastal states from Florida to Delaware saw temperatures that ranked among their four warmest. Warmth during the overnight hours was especially notable, with record-warm average minimum temperatures in 12 states spanning the Southeast, Mid-Atlantic and Ohio Valley.

Alaska’s average temperature for July was 55.3°F, 2.6°F above the 1925–2000 average, ranking in the warmest third of the 101-year record. Much of the state, particularly the North Slope, saw above-average temperatures. Hawaiʻi’s average temperature was 69.3°F, 0.5°F above the 1991–2020 average, placing it in the middle third of the 35-year record.
For the year to date (January–July), the CONUS averaged 53.3°F, 2.0°F above average, also ranking in the warmest third of the historical record. Temperatures were above average across most of the country, with several states in the West and Southeast much above average. Alaska’s year-to-date average temperature was 30.9°F, 5.1°F above average, marking its fourth-warmest January–July on record. Hawaiʻi tied its warmest January–July period on record, with an average temperature of 66.3°F.
Precipitation
The average precipitation for the CONUS in July was 3.00 inches, 0.22 inch above the 20th-century average, ranking in the wettest third of the 131-year record. July featured a patchwork of wet and dry conditions across the country. Below-average rainfall was observed in the Southwest, Great Basin and central Rockies, as well as much of the Southeast and Northeast. In contrast, above-average precipitation occurred across parts of the Plains, the middle and upper Mississippi Valley and portions of the Ohio Valley and Mid-Atlantic. Highlighting this variation, Utah experienced its second-driest July on record, while Iowa recorded its second wettest.

Alaska averaged 2.75 inches of precipitation for the month, 0.53 inch below the 1925–2000 average, placing it in the driest third of the 101-year record. Much of the state received below-normal precipitation. Hawaiʻi received 3.06 inches, 1.58 inches below the 1991–2020 average, also ranking in the driest third of its 35-year record.
The January–July precipitation total for the CONUS was 18.81 inches, 0.73 inch above the long-term average. Precipitation was below average across most of the West, while much of the Plains and Mississippi and Ohio Valleys were above average for the year to date. Alaska recorded 19.37 inches of precipitation from January through July, 2.46 inches above average, ranking in the wettest third of its 101-year record. Hawaiʻi received 25.24 inches over the same period, 9.15 inches below average, placing it in the driest third of its 35-year record.
Drought
According to the July 29 U.S. Drought Monitor report, about 31.0% of the contiguous U.S. was in drought, a decrease of approximately 1.4% since the beginning of the month. Drought persisted across much of the western CONUS, continuing to expand or intensify in the Northwest and central Rockies. Drought contracted or was reduced in intensity across parts of the Plains, the upper Mississippi Valley and the Florida Peninsula.
Notable Flooding Events
In July, the National Weather Service issued 1,434 flash flood warnings and 17 flash flood emergencies across the nation. Major flooding events included the following:
- July 4–7: The Texas Hill Country endured one of the deadliest flash floods in state history, with at least 135 fatalities. A rapidly moving mesoscale convective complex—fueled by moisture from Tropical Storm Barry’s remnants—dumped up to 20 inches of rain, triggering catastrophic flooding along the Guadalupe River.
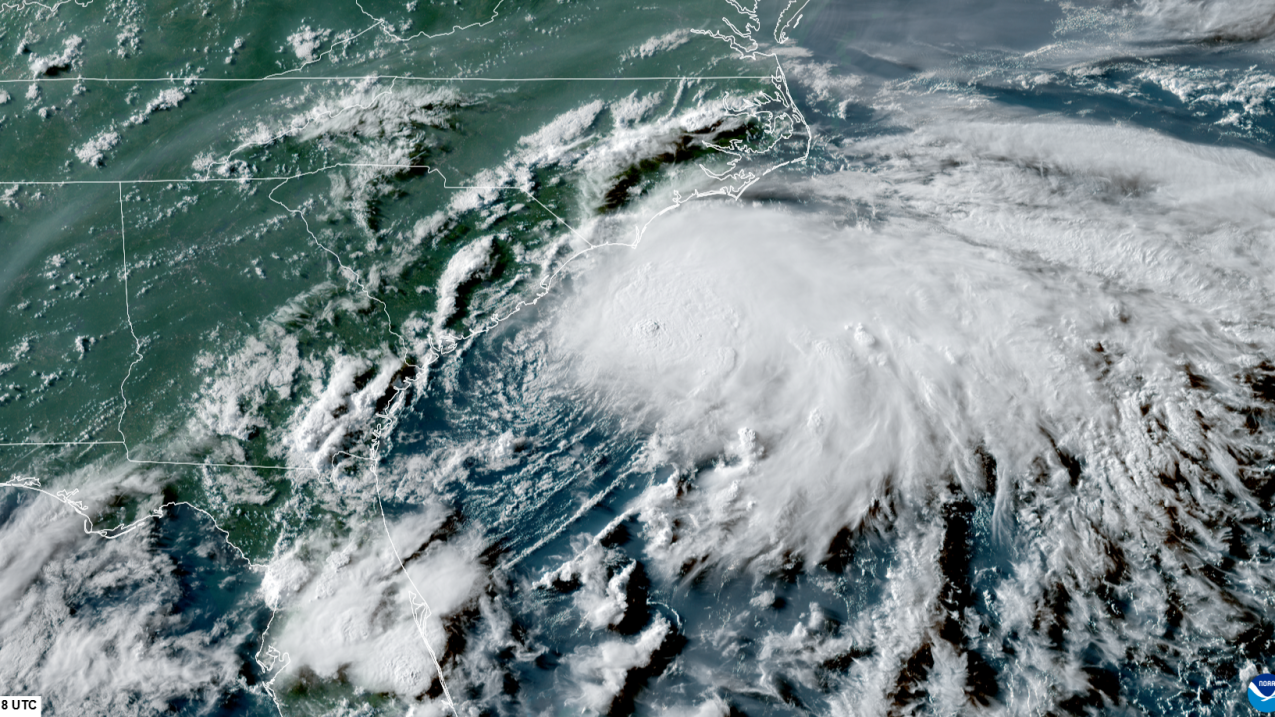
- July 5–7: The remnants of Tropical Storm Chantal stalled over central North Carolina, delivering 8–12 inches of rain. The resulting flooding led to multiple rescues and three fatalities in Chatham County.
- July 8: Heavy monsoon rain over burn scars near Ruidoso, New Mexico, triggered flash flooding that killed three people, destroyed multiple homes and prompted over 80 water rescues. The Rio Ruidoso crested at a record 20.2 feet.
- July 8: In Chicago, more than 5 inches fell near the United Center in just 90 minutes, flooding viaducts and prompting water rescues.
- July 14–15: A slow-moving storm system dropped 3–6+ inches of rain across parts of New Jersey and the New York City metropolitan area, including more than 2 inches in one hour in Central Park—a July record. Flash flooding caused two deaths in New Jersey and prompted states of emergency in both states.
- July 24–25: Severe storms brought damaging winds and up to 6 inches of rain in under 90 minutes, triggering widespread flooding across Chicago.
- July 31: A rapidly developing convective system along the I-95 corridor brought rainfall rates exceeding 2 inches per hour, with up to 5 inches in New York City and 7 inches in parts of New Jersey. Flash flooding once again prompted emergency declarations in both states.
Monthly Outlook
Above-average temperatures are favored across much of the West and East, with increased likelihood over the Southwest and central Rockies, the Florida Peninsula and the far Northeast. Precipitation is likely to be below average from West Texas through the central and southern Rockies into the Four Corners area, while much of the Southeast is expected to experience above-average rainfall. In Alaska, warmer and wetter-than-average conditions are favored in the southeast, in contrast to below-average precipitation expected in the northwest. Drought is expected to persist across much of the western third of the country and in some areas of the Plains. Visit the Climate Prediction Center’s Official 30-Day Forecasts and U.S. Monthly Drought Outlook website for more details.
Significant wildland fire potential for August is above normal across much of the West and Hawaiʻi, and parts of north-central Texas and Oklahoma. For additional information on wildland fire potential, visit the National Interagency Fire Center’s One-Month Wildland Fire Outlook.
For more detailed climate information, check out our comprehensive July 2025 U.S. Climate Report scheduled for release on August 13, 2025. For additional information on the statistics provided here, visit the Climate at a Glance and National Maps webpages.